Crime data and statistics: what the numbers can tell you
Understand crime statistics through police records, victim surveys, rates and reporting changes. Worked examples show how a true crime headline can mislead.

Crime data and statistics can tell you whether a pattern is changing, but only after you know what was counted. A police report, a survey and a court table can all concern violence while measuring different events, people and periods. That is why two apparently conflicting headlines can each contain an accurate number.
If a documentary leaves you wondering how common a crime is, the next step is to identify a suitable measure. A memorable case gives you a story to investigate. A dataset needs a population, a definition and a method before it can tell you anything about frequency. Keeping those jobs separate makes both the case and the wider picture easier to understand.
TL;DR
Keep the definition, population, period and source beside every crime number. Police records cover registered events; victim surveys estimate experiences within their survey population; court statistics describe decisions. Raw totals, population rates and the share of people affected answer different questions. Before interpreting a rise or fall, check reporting coverage, uncertainty, revisions and whether the categories stayed comparable.
A crime number starts with a measurement choice
Begin with the question you want answered. How many incidents were recorded? How many people experienced violence? How many defendants were convicted? Those are separate questions, even if the tables all appear under a heading about crime.
The BJS Criminal Victimization report for 2024 estimates 23.3 nonfatal violent victimizations per 1,000 people aged 12 or older in the United States. It also reports that 1.45% of that population experienced at least one violent victimization. The first measure counts experiences; the second counts people affected at least once.
A person can experience more than one event, so those values do not need to match. The survey includes simple assault, while some police-based violent-crime categories exclude it. A familiar label such as “violent crime” needs to travel with its definition.
Police records and victim surveys cover different experiences
Police data depend on what reaches the authorities and is recorded within the collection rules. Survey participants can report experiences that never became a police report. That difference is part of the reason to keep both sources, rather than choosing whichever produces the preferred headline.
The FBI release on reported crime in 2024 gives an estimated 4.5% decrease in violent crime compared with 2023 and a 14.9% decrease in murder and non-negligent manslaughter. Its violent-crime category comprises murder, rape, robbery and aggravated assault. Those definitions differ from the nonfatal survey measure that includes simple assault.
The release describes submissions from agencies covering 95.6% of the US population. Coverage is not the same as capturing every offence that occurred. The national estimates also have a method; an agency submission, a raw reported total and an estimated national value are distinct products.
The last time we checked these two publications was October 14, 2026. They are dated examples about 2024, rather than a claim to describe all crime during 2026. Later collections require their own checks.
One person can appear in more than one event
The difference between frequency and people affected matters particularly when violence repeats. An event count allows one person to contribute several experiences. A prevalence measure counts that person once if the question asks whether they experienced any qualifying event during the period.
The definition of true crime concerns stories about actual events, which still need a different kind of evidence to establish how common those events are. A public account can explain an experience and a response to disclosure. A social feed does not provide a defined random sample of everyone who experienced abuse.
The distinction does not reduce the importance of an individual account. It tells you which question the evidence can answer. To estimate prevalence, you need a suitable population survey, its wording, sampling and uncertainty; to understand the account, you need its attribution and context.
The number that changes when you add population
A rate divides a count by a population or another relevant exposure measure. It helps compare differently sized places when the numerator and denominator cover compatible people, areas and periods. It does not repair incompatible crime definitions.
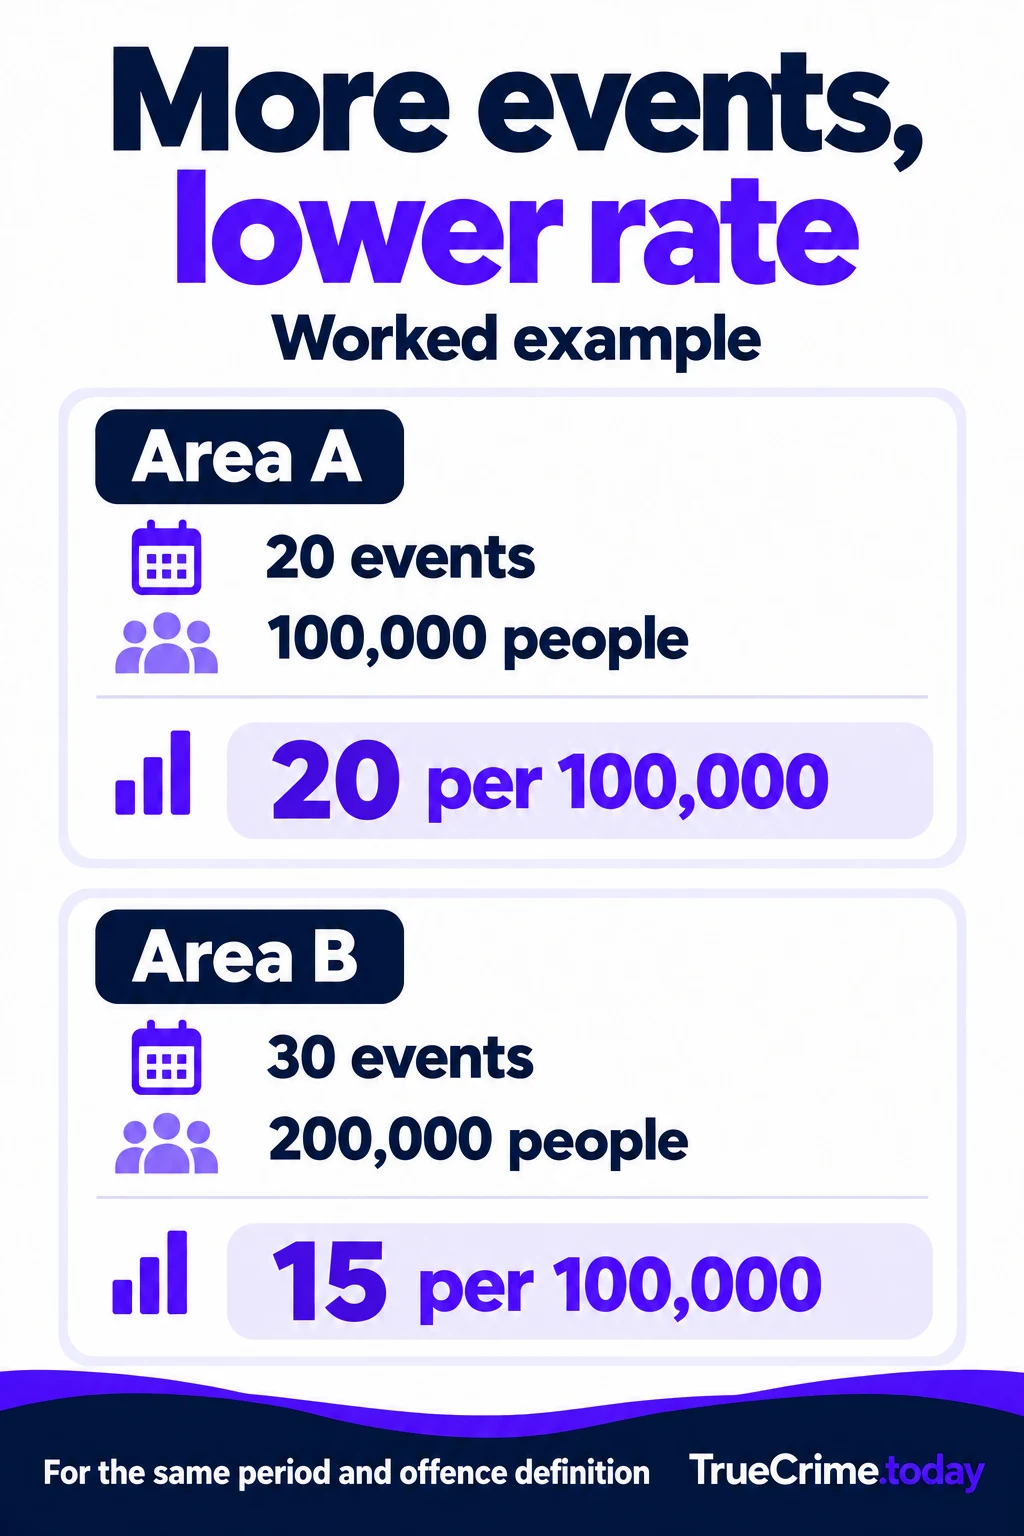
Take a hypothetical example with the same offence definition and time period. Area A records 20 events among 100,000 people. Area B records 30 among 200,000. The rates are calculated as events ÷ population × 100,000: 20 for A and 15 for B.
B has 50% more events, calculated as (30 − 20) ÷ 20 × 100. Its population rate is 25% lower, calculated as (15 − 20) ÷ 20 × 100. Both statements are true within this example. Neither describes a real town or your personal chance of being harmed.
Why a lower total may still hide a serious problem
A total can fall while an important subgroup experiences a different pattern. Age, sex, relationship to the offender, location and offence category can reveal differences that the overall sum conceals. The useful response is to inspect a relevant breakdown with enough observations to support it.
A rate also depends on the denominator. A neighbourhood with many commuters or visitors may not be well described by dividing every local event by its resident population alone. You need to ask whether the chosen population matches who was exposed to the events being counted.
For a genuine trend, compare the same category and coverage over time. A small count moving from two events to four has doubled, but the absolute change is two. Both the percentage and the count belong in the explanation. A large relative movement in a small series can be unstable.
A country comparison needs matching definitions
The distinctions in case-analysis methods keep an allegation separate from a court finding. The same care with categories helps distinguish police records, court outcomes and survey experiences. Crossing a border adds another problem: similar offence names can cover different definitions and collection rules.
The ONS homicide series records 522 victims across 508 incidents in England and Wales for the year ending March 2025. CBS reports a provisional 103 homicide victims in the Netherlands for calendar 2025. Territory, period and population differ. Dividing the totals would not produce a sound comparison of personal risk.
A Russian administrative category combining murders and attempted murders adds a definition mismatch. Some attempts have no fatal victim, so that combined category cannot be treated as a homicide-death count. The category must remain visible before any comparison begins.
A common international classification can help map definitions. You still need to examine recording, population coverage and reference dates. Comparable labels are the beginning of the work, rather than proof that every national value measures the same thing.
Dates, revisions and breaks in a trend
Keep at least two dates: when the events or observations occurred, and when the dataset was published. For police records, the registration year can also matter. A historical event recorded later may enter a different year’s series from the year in which it happened.
Revisions can add late records, correct classifications or alter estimation. A revised figure is worth understanding, but the fact of a revision does not by itself establish wrongdoing. Look for the publisher’s explanation and preserve the version you used.
The FBI’s 2024 release illustrates a documented definition issue: its 2013–2024 violent-crime estimates use the revised rape definition, while 2005–2012 figures retain the legacy definition. A long line chart spanning that boundary needs the change explained. A smooth drawn line cannot make unlike categories alike.
The BJS report also identifies its 2024 data as coming from the legacy survey instrument during a split-sample redesign. New and old instruments need methodological comparison before their estimates become a single effortless trend. The publication notes tell you where that work is needed.
A fall in crime does not identify its cause
A before-and-after change can be real without showing why it happened. Reporting behaviour, recording rules, population changes, policing and underlying offending can all affect the observed series. To attribute the change to a policy, you need evidence that distinguishes competing explanations.
That does not mean every decline is an artefact. It means the claim should stay at the level the evidence supports. “Recorded events fell in this period” can be established by the series. “This intervention caused the fall” requires a separate comparison and research design.
Likewise, rising records can reflect both worsening harm and improved reporting. A survey, administrative audit or another independent measure can help examine the alternatives. Agreement between sources is informative when their scopes and limitations are clear.
How media selection changes the story you notice
Documentaries and podcasts choose stories for reasons that include access, unresolved questions, narrative and public interest. They do not select every offence with a known equal probability. The resulting collection cannot supply a representative crime sample.
A case shown repeatedly can feel common, while a frequent offence with little visual material receives less attention. That is a question about selection, not a measured percentage about how every viewer thinks. To discuss media effects quantitatively, you would need a study of audiences and exposure, rather than infer an effect from a familiar example.
When a production puts a statistic beside one case, ask whether the population and category match the case being discussed. A global count does not establish the prevalence of one particular relationship pattern, and a national average does not explain an individual’s motive.
Crime, convictions and prison populations follow different clocks
A police event, prosecution and court outcome can occur in different years. Counting each year’s entries does not necessarily follow the same people through a single pipeline. Dividing convictions by registered crimes can create a misleading success rate.
Prison population is another measure. A count of people held on a date is a stock; admissions during a year are a flow. Sentence length, releases and remand affect the stock. More people in prison does not automatically mean more new crimes occurred in that year.
To follow outcomes properly, look for data linking a defined group of cases over time, with clear rules for multiple defendants, offences and dispositions. Annual totals remain useful for their own purposes, but their units cannot be silently substituted.
How to read a crime chart without being misled
Write the claim in one sentence, then identify numerator, denominator, period and geography. Check whether the value is observed, estimated or provisional. For an estimate, inspect uncertainty; for a trend, inspect changes in coverage and definition.
Next read the axis. A shortened vertical scale can make a small movement look dramatic. Percentages, percentage points and population rates need their own labels. A rise from 10% to 12% is two percentage points and a 20% relative increase; the description should tell you which calculation was used.
Finally, test whether the conclusion exceeds the data. A count can describe recorded events, a survey can estimate qualifying experiences, and a court record can establish a particular outcome. None alone provides every answer about harm, safety and justice.
Questions about crime data and statistics
Does a rate describe my own chance of being harmed?
A population event rate is not automatically an individual probability. Repeated victimizations, different exposure and subgroup patterns matter. Preserve the unit and avoid converting events into people without suitable evidence.
Can a survey measure every crime?
Its sampling population, questions and willingness to disclose place limits on it. Homicide cannot be measured by asking the deceased person about their experience. Police, health and court sources may be needed for different questions.
What would make a trend convincing?
Stable definitions, compatible periods, good coverage and uncertainty appropriate to the data make it easier to interpret. Repeated observations and other suitable measures can strengthen the reading. A causal explanation still needs its own evidence.
Keep the definition with the number
Choose the question first and keep the labels with the figure. That habit lets you enjoy a crime story while checking whether its wider claims are supported by the data used to tell it.
Send the public dataset link and the figure, definition or comparison you want to discuss. Do not send passports, contracts, bank details or other personal documents.
Ask about a crime statistic